Once logged in to the AI Concierge portal, you will see the dashboard. The dashboard is made up of widgets that will display statistics specific to your business and the assistants that are active.
The AI Concierge dashboard can be broken into three rows:
Top and Middle Rows #
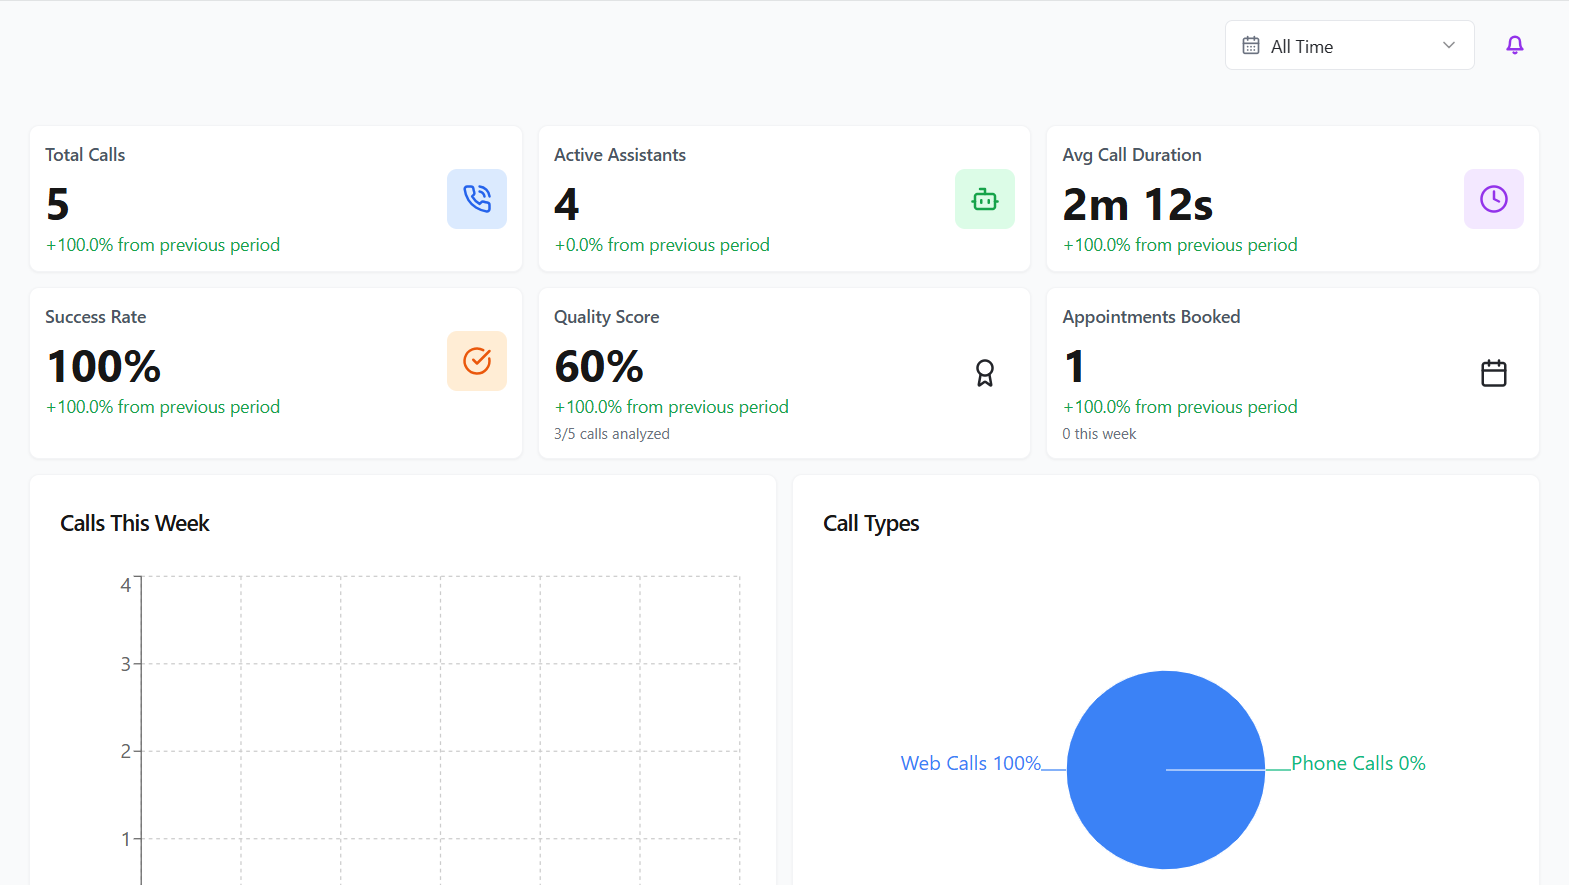
The top two rows collate information regarding handled call, including the total number of calls answered by all of your active AI assistants. The average call direction and overall success rate for these calls. This section will also show you the number of appointments currently booked across the system.
Below the top two rows are two additional widgets. The first shows how many calls were handled by your AI assistant/s in the past week, whilst the second outlines the type of call that was handled. Depending on your setup this may be split between web calls, calls that originate from your website through a browser, or calls via a traditional phone number.
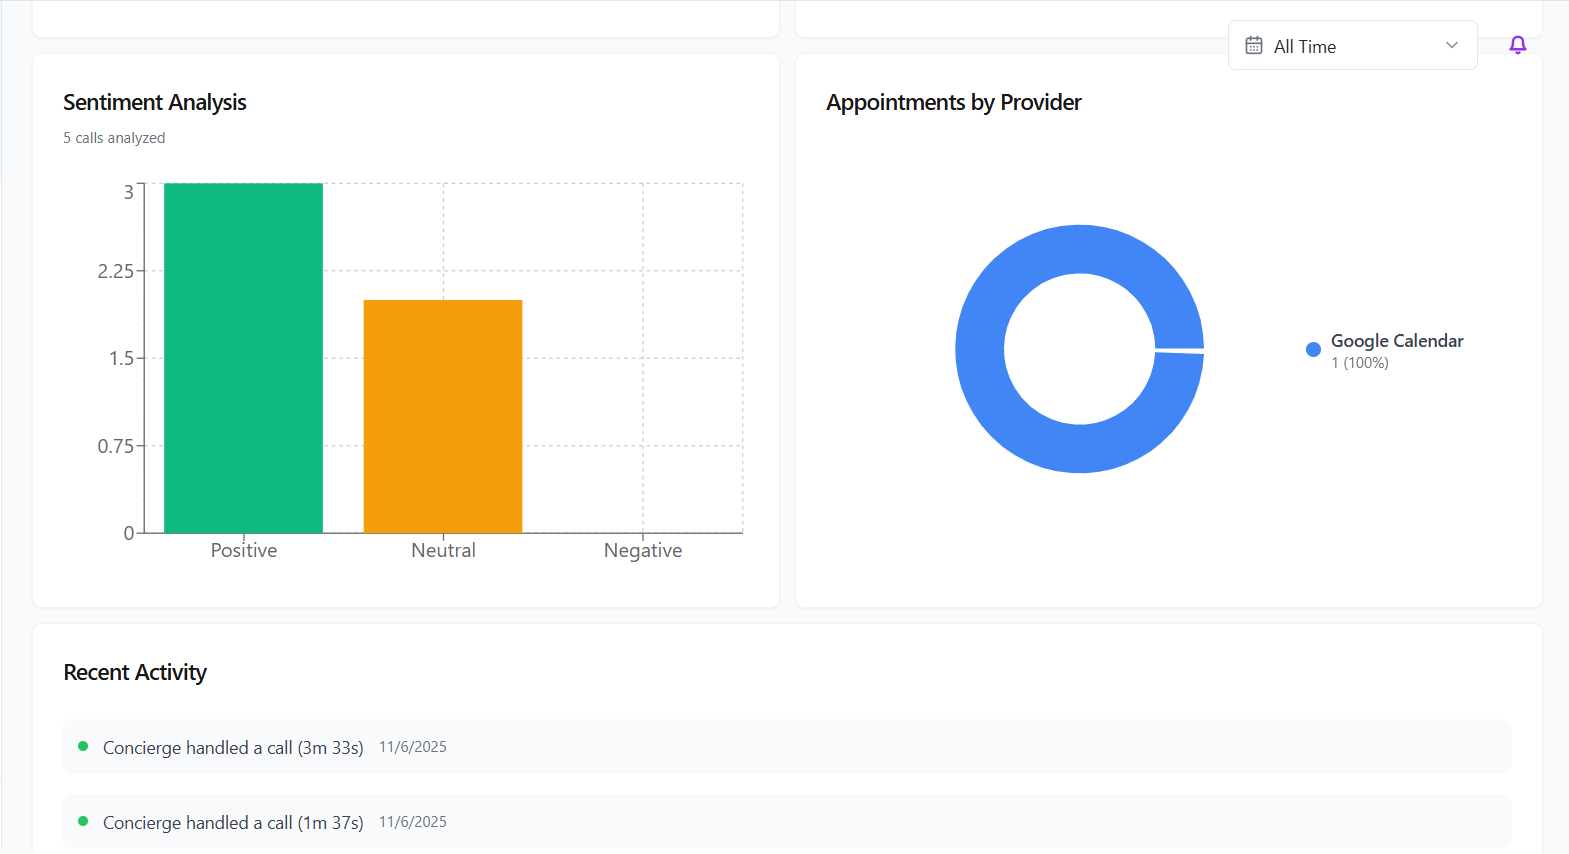
Bottom Row #
The sentiment analysis widget will plot calls handled by the assistant/s and split them into positive, neutral and negative calls. Calls can be listened to via the Call Records section of the portal. How your appointments are split between your integrated calendars can also be seen here.
Finally, any recent activity made by your assistants, such as handling calls, will be recorded at the bottom of the dashboard.