
If you believe that your customers circuit is experiencing Packet Loss or High Latency issues, then there are a couple of checks that you can do before you contact us.
Step 1
We should do a “ping” test to check that the connection between your computer and a particular domain is working correctly.
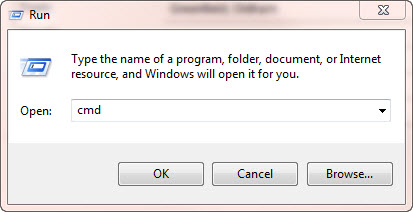
Go to “Start” on your PC and then “Run”.
Within the text box of the “Run” facility, type in “cmd” and press “OK”.
This can also be achieved by going to Start > All Programs > Accessories > Command Prompt
Step 2
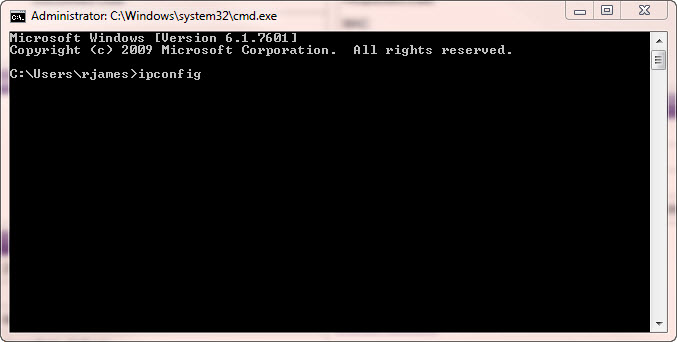
Type in “ipconfig” and press enter.
Step 3
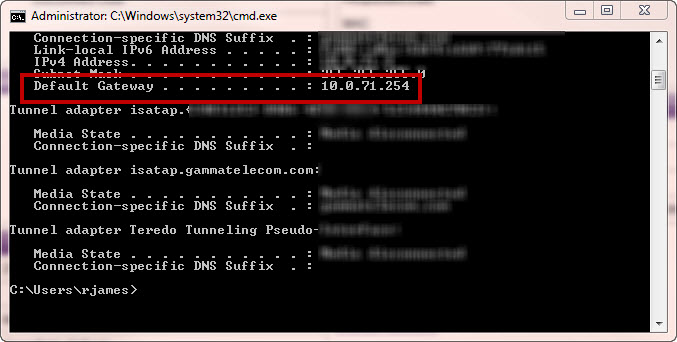
Look for the Default Gateway address and make a note of this.
Step 4
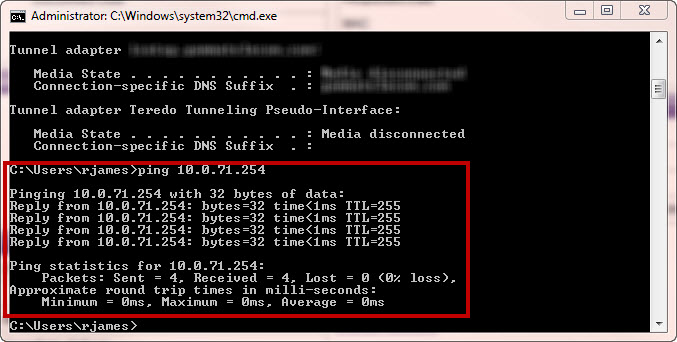
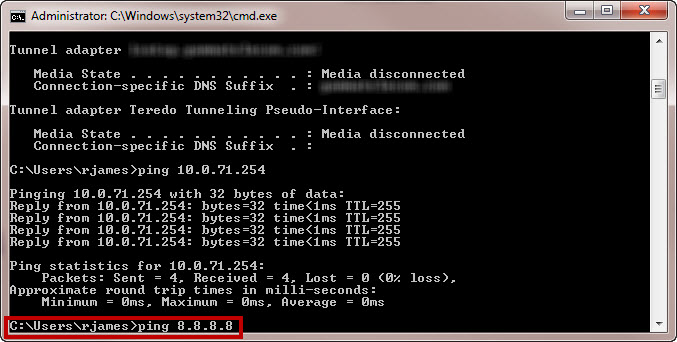
Type in “ping” followed by a space, then the Default Gateway address and press enter.

Step 5
If you get replies from the ping (like in the screen shot across), this means that you can connect to the router and you should proceed to Step 6.
If you get no results from the router, this means that you have no connection to the router and would need to contact your IT Administrator.
Step 6
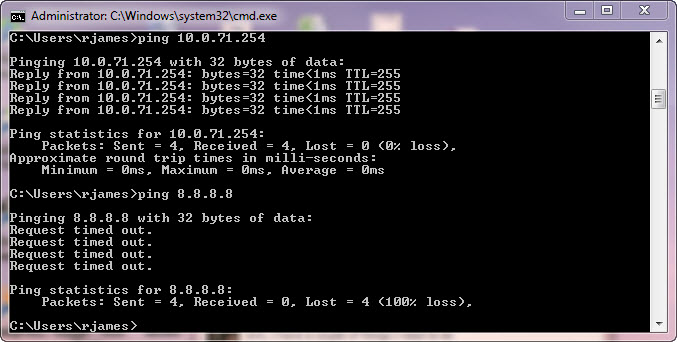
If you get a reply from the router ping, you would need to ping a live web address. We recommend sending a ping to Google’s address.
To do this, type in “ping 8.8.8.8” and press enter.
Step 7
If you are unable to get a reply from the Google DNS ping (example in the screen shot across), this would suggest that it is a local issue firewall issue and you would need to speak to your IT Administrator regarding this. If your IT Administrator confirms that the firewall is working as it should be, contact Gamma.
If you have got a ping result back from Google, you have access to the Internet and need to do some more tests. Please see Step 8.

Step 8
We now need to ping a web address, again we recommend google. In the command prompt, type in “ping google.co.uk”.
If you get no results back, this would suggest a DNS error. You should speak to Gamma if you have got this error.
If you have got results back, then you should be OK to view web pages. If you are still unable to view web pages, then this could be a Browser error or a proxy may be enabled, and again you’d need to speak to your IT Administrator.
Trace Route #
Step 1
Once again in cmd prompt, type in “tracert cbs.com” and hit enter.
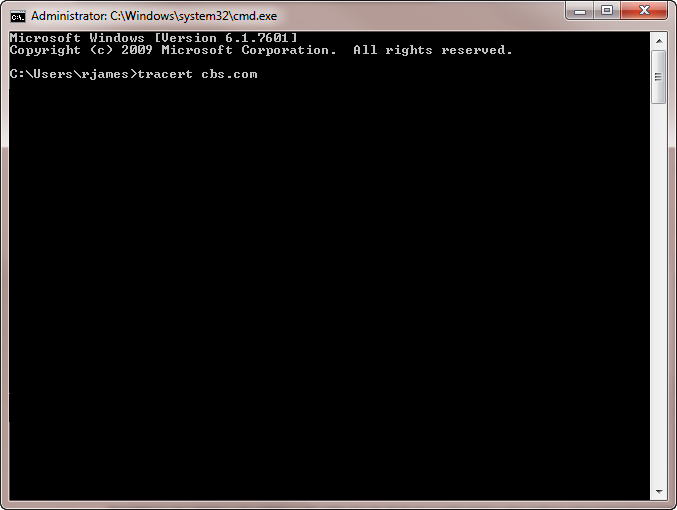
Step 2
Trace Route will now trace the route a packet of information takes from your computer to the cbs.com address, which is located in Los Angeles.
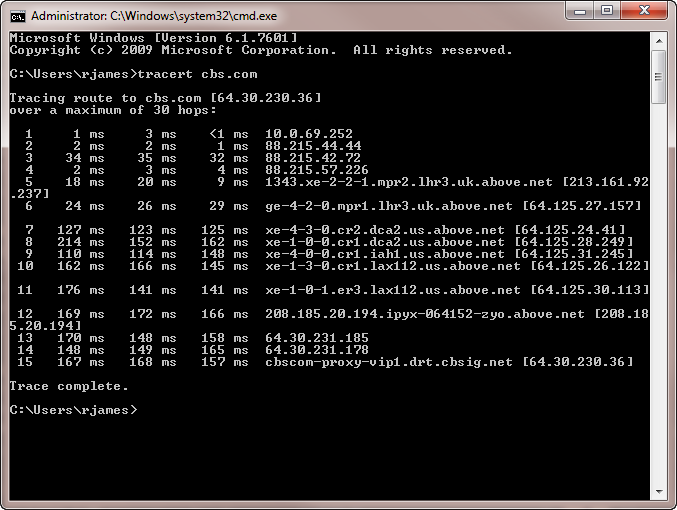
Look at the below table for a description on what the trace route results mean:
Each hop is tested three times, hence three response times
If you get an asterisk, this means that the hop has timed out on that router, so the next line will attempt a different router.
Use this Airport City Codes Reference website to see where a hop is currently located. Routers commonly use airport city reference codes so you can roughly see where a packet is.
Hop Number | 1st Hop Response Time | 2nd Hop Response Time | 3rd Hop Response Time | Destination of Hop | Description |
1 | 1ms | 3ms | <1ms | 10.0.69.252 | This is the internet gateway on the network that the traceroute has been done from. We’d expect the response times to be really quicker here (i.e. as close to 0ms as possible) |
2 | 2ms | 2ms | 1ms | 88.215.44.44 | The packet is now passing through the Gamma network. |
3 | 34ms | 35ms | 32ms | 88.215.42.72 | The packet is now passing through the Gamma network. |
4 | 2ms | 3ms | 4ms | 88.215.57.226 | The packet is now passing through the Gamma network. |
5 | 18ms | 20ms | 9ms | 1343.xe-2-2-1.mpr2.lhr3.uk.above.net213.161.92 | The packet has now reached another router in the UK, and based on the “lhr3” code, we can tell that this router is near London (lhr is the airport code for London Heathrow). We’d expect a little jump in response time for the packet now. |
6 | 24ms | 26ms | 29ms | ge-4-2-0.mpr1.lhr.uk.above.net64.125.27.157 | The packet has now hopped to another router that is still in the UK and still near London based on the “lhr” code. |
7 | 127ms | 123ms | 125ms | xe-4-3-0.cr2.dca2.us.above.net64.125.24.41 | The packet has now hopped over the Atlantic, as we can see with the “.us.” within the destination, and based on the airport code, we can see it’s on the east coast around Washington DC (dca). We can see that the response time has gone up now, which is to be expected as it is now covering a greater geographical distance. |
8 | 214ms | 152ms | 162ms | xe-1-0-0.cr1.dca2.us.above.net64.125.28.249 | The packet has now hopped over to another router around the Washington DC area. |
9 | 110ms | 114ms | 148ms | xe-4-0-0.cr1.iah.us.above.net64.125.26.122 | The packet has now hopped to a new geographic area, this time Houston, Texas (iah is the airport code for Houston). We’d expect to see similar times to the hop that happened from London to Washington as it’s a similar geographical distance. |
10 | 162ms | 166ms | 145ms | xe-1-3-0.cr1.lax112.us.above.net64.125.26.122 | This hop is now Houston to Los Angeles, California (lax is the airport code for Los Angeles). This is quite a large geographic distace for this hop, so we’d expect it to be a little longer. |
11 | 176ms | 141ms | 141ms | xe-1-0-1.er2.lax112.us.above.net64.125.30.113 | This hop is to another router within the Los Angeles area. |
12 | 169ms | 172ms | 166ms | 208.185.20.194.ipyz-064152-zyo.above.net208.18.5.20.194 | And now it’s getting to close to the server that cbs.com is hosted on, this is on a zayo server. |
13 | 170ms | 148ms | 158ms | 64.30.231.185 | A router within the zayo network. |
14 | 148ms | 149ms | 165ms | 64.30.231.178 | A router within the zayo network. |
15 | 167ms | 168ms | 157ms | cbscom-proxy-vip1.drt.cbsig.net6430.230.36 | This is the computer / proxy that cbs.com is hosted on. The packet has hopped 15 times from my computer in Manchester, through to London, Washington, Houston and finally Los Angeles. |
You are unable to check the Bandwidth for Converged IPDC and Internet Access products. If you have Converged IPDC and Internet Access, then please skip to the “Local Checks” section.
A cause of packet loss / high latency for Ethernet is the bandwidth being maxed out. You can check this by using the Ethernet Service Management tool within the Gamma Portal.
Step 1
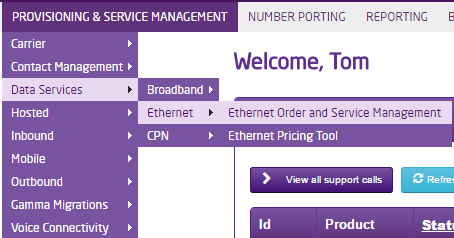
Log into the Gamma Portal and go to Provisioning and Service Management, Data Services, Ethernet and select Ethernet Service Management.
Step 2
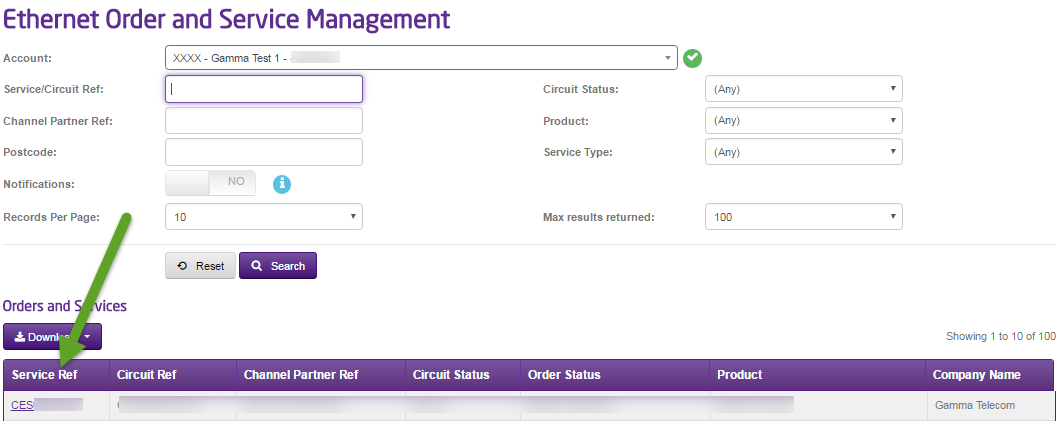
Search for the Ethernet circuit you are having the packet loss or high latency issues by any of the criteria that is available to you. We’d recommend searching using the Service Ref, which begins “CES” followed by a series of numbers.
Click “Search”.
Step 3
To get to the Service Management screen, click into the Service Reference, which is a purple link.
Step 4
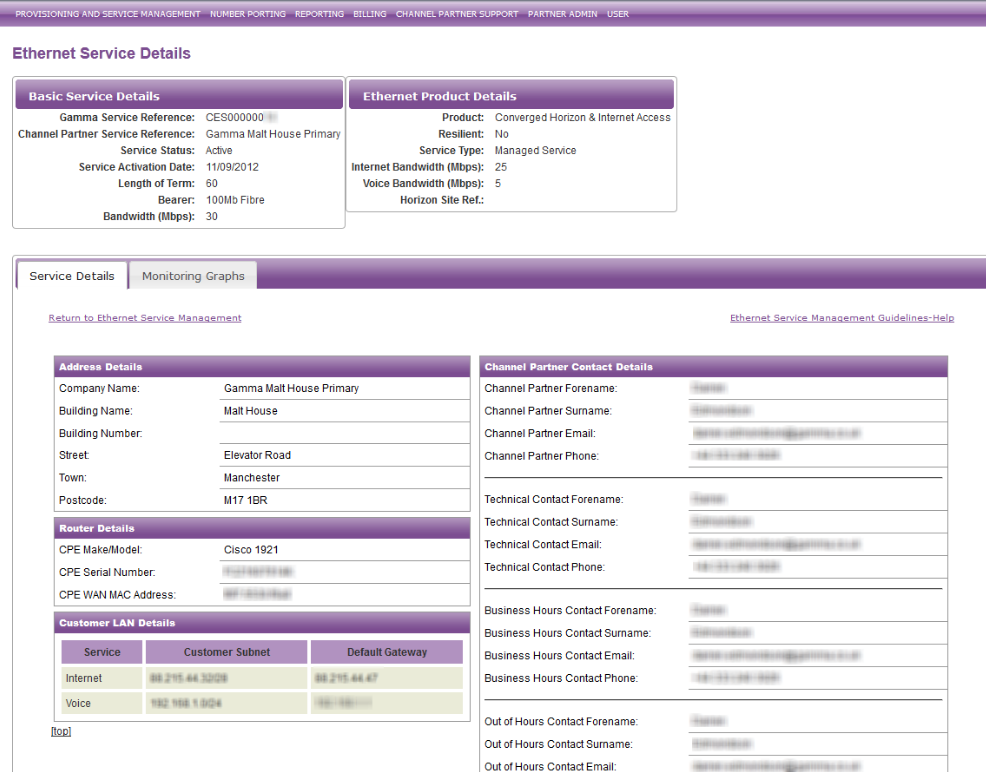
You’ll be taken to the main Ethernet Service Details screen, which is broken up into three sections. These sections are:
Header
This includes the basic service details and the Ethernet product details.
Service Details
Here is information on where the circuit is, what router is used with the circuit and it’s Serial Number and WAN MAC Address, Customer Subnet, Default Gateway and Channel Partner/Technical/In and Out of Hours contact details.
Monitoring Graphs
These are some graphs that we’ve got that will allow you to have a look at how the circuit is being used, broken down by hourly, daily, weekly, monthly and yearly graphs. These graphs are for the WAN port traffic and do not represent the LAN.
Step 5
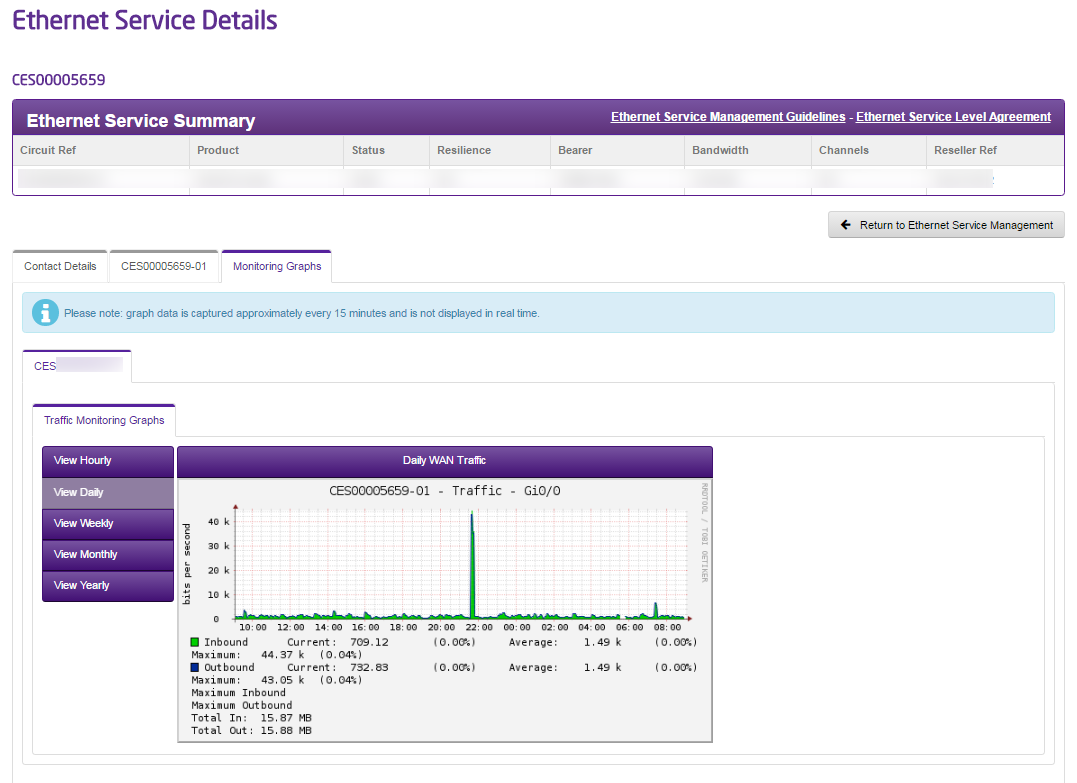
Click the “Monitoring Graphs” tab to load up the graphs. These are split into the following:
Monitoring Graphs
The Monitoring Graphs tab is displayed only for circuits in Active status. These are some graphs that we’ve got that will allow you to have a look at how the circuit is being used, broken down by hourly, daily, weekly, monthly and yearly graphs.
Click the “Monitoring Graphs” tab to load up the graphs. These are split into the following:
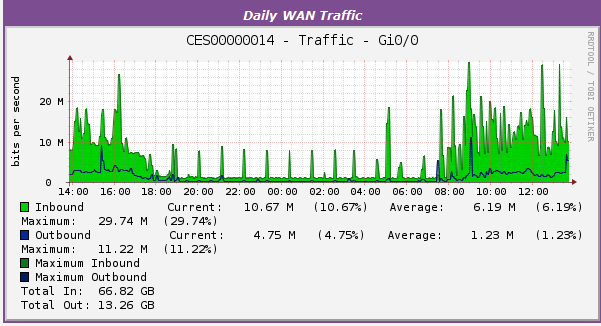
Hourly

Daily
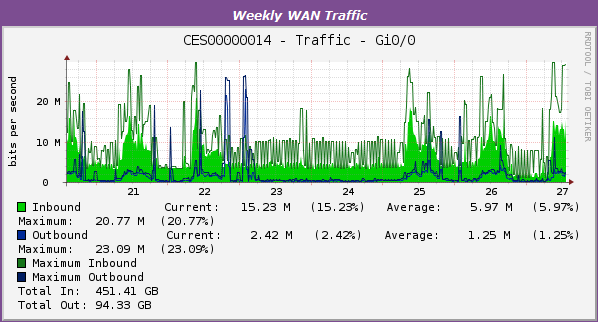
Weekly
Monthly

Yearly
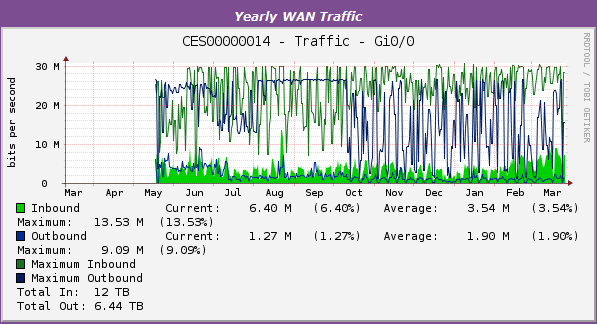
We need to compare the bandwidth (you can get this from the header) with the graphs to see if your customer is coming anywhere near the bandwidth allowance. You use the different views of the graphs to see if this is case by comparing it with the bandwidth your customer pays for and what the bars/lines on the graph come to. In this example, we can see that we’ve got 30MBPS Bandwidth and on the daily graph we’re using on average 6.16MBPS with a maximum usage of 29.74MBPS.
If the bandwidth is being regularly maxed out, then you should speak to your BDM about increasing your bandwidth.
If your bandwidth is not being maxed out, then you should contact the Service Desk (details in the Wholesale Customer Service Plan) with the results of your Ping, Trace Route and Bandwidth checks.
