
Fault Diagnostic Tool and RADIUS Reports #
This tool allows you to run key diagnostic tests for each of your users. It also provides information on support calls and service requests against a user’s broadband and PSTN line (if it is with Gamma). Integrated into this tool are a set of RADIUS reports which you can run for diagnostic purposes.
By automatically running several operations and queries (simultaneously and at speed), providing a set of high-level results returned and displayed in a simple and clear format, this tool helps you quickly identify where a customer reported problem may lie. The tool not only gives you the visibility of all the key RADIUS information you need, but more importantly, with a single click of the mouse it does the same amount of work that a support operative could need up to 3-4 minutes to complete. Where you need to drill down for more information, the tool allows you do this as well. It also shows if there are any support cases open, or cases that have been open in the last 30 days, against not only the DSL service, but also the underlying (Gamma) PSTN line.
To operate the tool, go to the main portal menu tab ‘Broadband’ >> ‘Broadband Service Management’. Now find the subscriber you wish to diagnose. Click on the ‘Fault Diagnostics’ link at the bottom right of the screen and this will trigger a series of processes / tests the results of which are then displayed on the screen.

You need to understand the meaning of the following icons to work with the tool.
![]() – Test passed.
– Test passed.
![]() – Test failed.
– Test failed.
![]() – Service status warning.
– Service status warning.
![]() – provides helpful information about the test that has been run.
– provides helpful information about the test that has been run.
Once you have used this tool a few times you will be able to quickly scan the page, and using the icons, know how to pin-point a potential issue quickly.
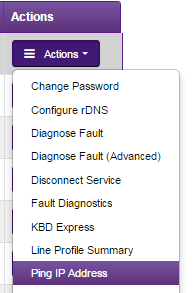
Ping Test #
Ping is a network administration utility used to test the ‘reachability’ of an endpoint and to measure the round-trip time for messages sent from an originating host to an end point. Ping operates by sending Internet Control Message Protocol (ICMP) echo request packets to the target end point and waiting for an ICMP response. In the process it measures the time from transmission to reception (round-trip time) and records any packet loss. The results of the test are provided in a statistical summary of the response packets received, including the minimum, maximum, and the mean round-trip times.
A Ping Test is an excellent tool to determine if there are certain issues with a subscriber’s service. It can be used to show if the subscriber’s line is reachable and can also be used to indicate potential quality issues such as latency and packet loss. It is not a definitive test, but it should be used in conjunction with the other tools provided.
Please note- For Ping Tests to work the end-point router must be enabled for ICMP*
*If a router is configured in natted then IMCP will be enabled, if it is configured in routed then IMCP will be disabled by default.
The first ping is typically much longer than the subsequent 3, as the first packet in a ping requires an ARP request/response as well.
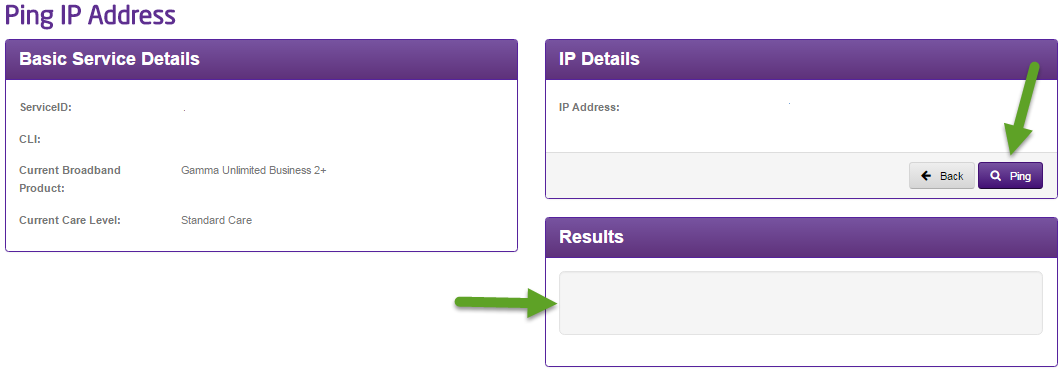
To operate, please go to the main menu tab ‘Data Services’ >> ‘Broadband’ >> ‘Broadband Service Management’. You are then required to find the subscriber you wish to test against. Then click on the ‘Ping Test’ link at the bottom right of the screen. You will be taken to the screen below:
When you get to this page if you click the ping button then the results will show in the results box below.
Broadband Health Check #
The Broadband health check is what you will see as your first page in the Gamma portal diagnostic journey, as you can see in the screenshot below, you will be presented with some basic service details, a testing details panel which contains a colour co-ordinated image (this image changes throughout the journey, this is addressed later on in this document) and the health check itself which consists of 5 sections; Synchronisation, Authentication, Stability, Performance and Speed.

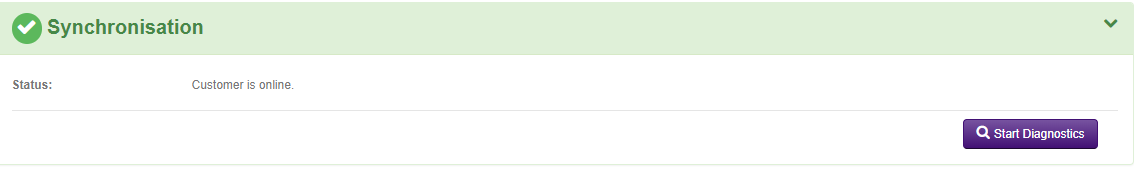
Synchronisation #
Synchronisation refers to the signal sent between the router and the equipment within the local telephone exchange. This is commonly denoted on routers by a light labelled either DSL, CD or Broadband. The synchronisation, or sync speed will vary depending on the length of the line from the local telephone exchange to the router, and the quality of the copper that the signal travels over. The sync speed will determine the maximum throughput speed available.
Should the sync show as amber or red, this suggests that there is a fault with the service. This fault could be with the equipment in the exchange, on the line between the exchange and the router, with the router itself, or with the internal wiring or additional equipment at your customer’s premises, for example, a microfilter or the cables.
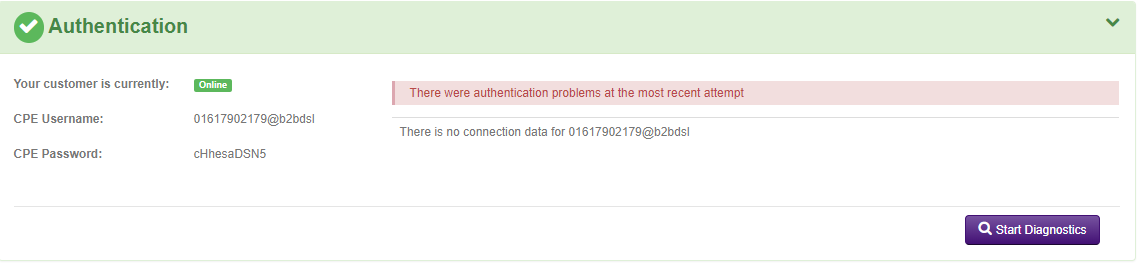
Authentication #
Authentication refers to whether the credentials (username and password) entered are authorised to access the services on the line. The credentials entered are checked against those held on the Radius server. Provided there is a match, access to the services is granted.
This panel will show whether your customer’s router is correctly authenticating to Gamma. The actual username and password that should be programmed into the router is shown, along with the last requests that were made to access the services, and whether they were successful or not.
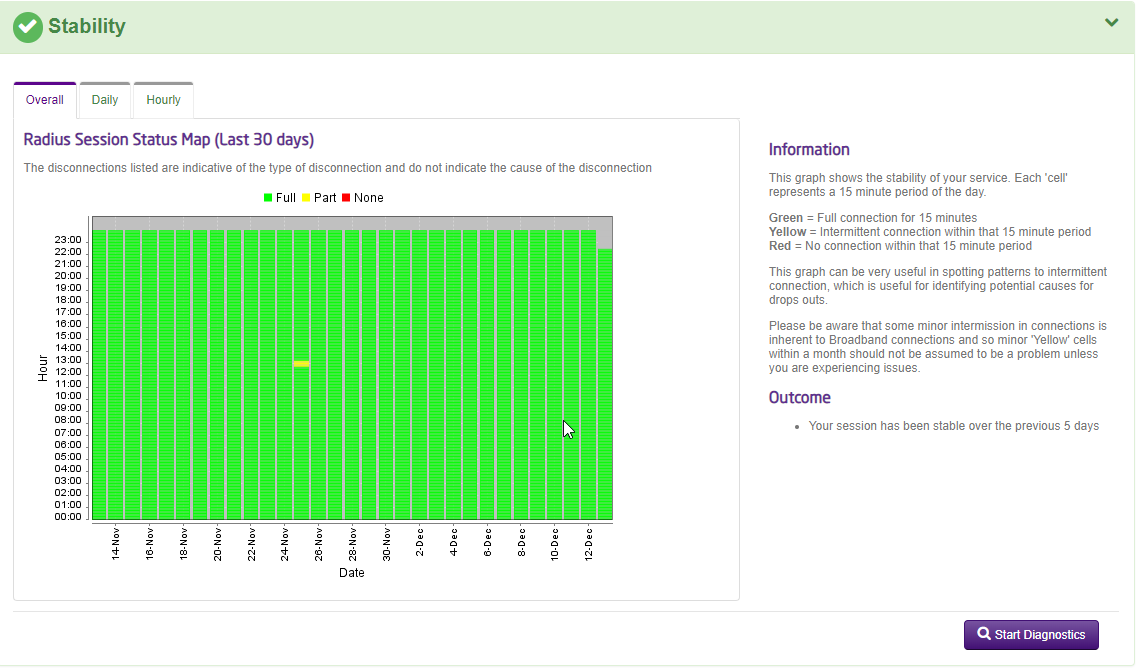
Stability #
Stability refers to how stable the connection is perceived to be. The more times that a connection drops out, the more unstable the connection appears.
The graph shows hourly/daily/monthly drops in your customer’s connection based on the last 30 days’ worth of data. This can be very useful in spotting patterns, particularly when an intermittent issue is reported. Commonly, alarms or PDQ machines operating over a broadband line can cause intermittent issues, however, you may also be able to spot a customer switching their router off on an evening or over the weekend, which to the Dynamic Line Management (DLM) on the line will look like a stability problem. Other faults may manifest themselves as intermittent connections, such as drops in wireless or slow speed. This graph can help you narrow these types of issue down as only disconnections from the Broadband network will show on here.
The graph shows data in 15 minute segments based on a RAG (Red, Amber, Green status), the colours will indicate the following:
Red – This means the connection has had no session during that 15 minute segment
Amber – The connection has had one or more drops during the 15 minute segment
Green – This means the connection has been fully live for the 15 minute segment
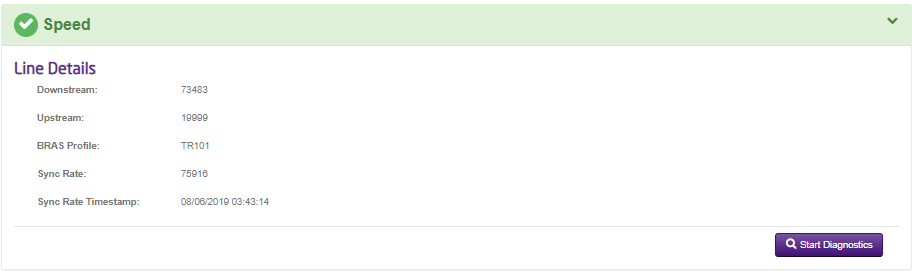
Speed #
This tab can simply be used to run a speed test on your customers line. When you initially open the tool, this tab will be grey indicating that the test has not actually be run yet – in order to run the speed test simply click on the tab and the test will begin automatically (please be aware this can take up to 30 seconds to produce results for you).
Performance #
This panel allows you as a user to monitor your service with us and get a view of its performance over a specified time period. We will have the data from your service since the day it was activated with us and you will be able to filter by a specified time range of your choice, as well as being able to specify the ‘duration’ length you would like the graph to cover. When reviewing this tab you will be able to identify any performance issues on your customers line by reviewing the statistics on RTT (Round trip-time) and packet loss.
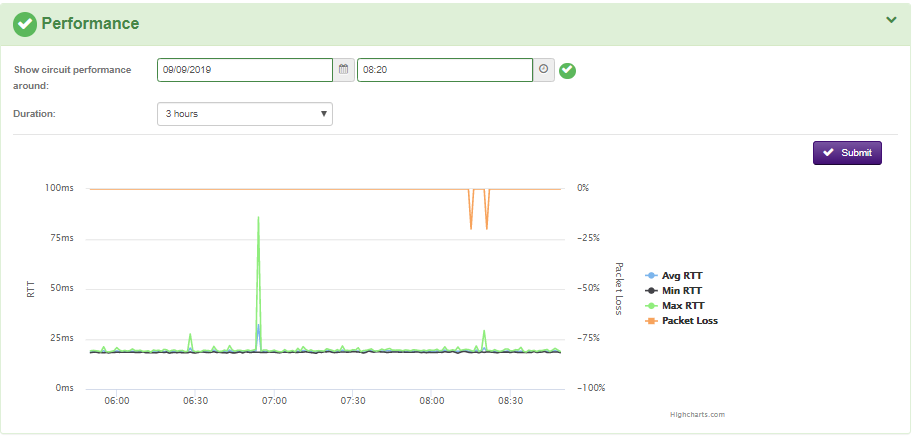
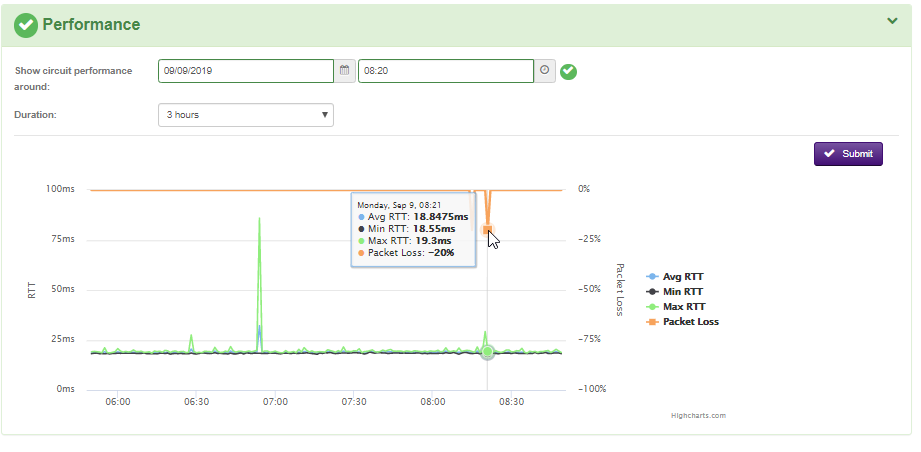
As you can see in the screenshot above, the different indicators on the graph are colour co-ordinated so you can easily distinguish between the information. For specific figures, you can simply hover your mouse over the area of the graph you are looking at and specific information will be displayed, for example in the screenshot below the user has been able to identify 20% packet loss on the line at this specific point.
End User Checks #
If you have reviewed all the available information on the health check and you feel there isn’t anything else you can do there, the next step of the diagnostics journey is to run through some of the end user checks. For any fault you raise into Gamma, we will always recommend that you have completed all of the first line checks which are listed in this page.
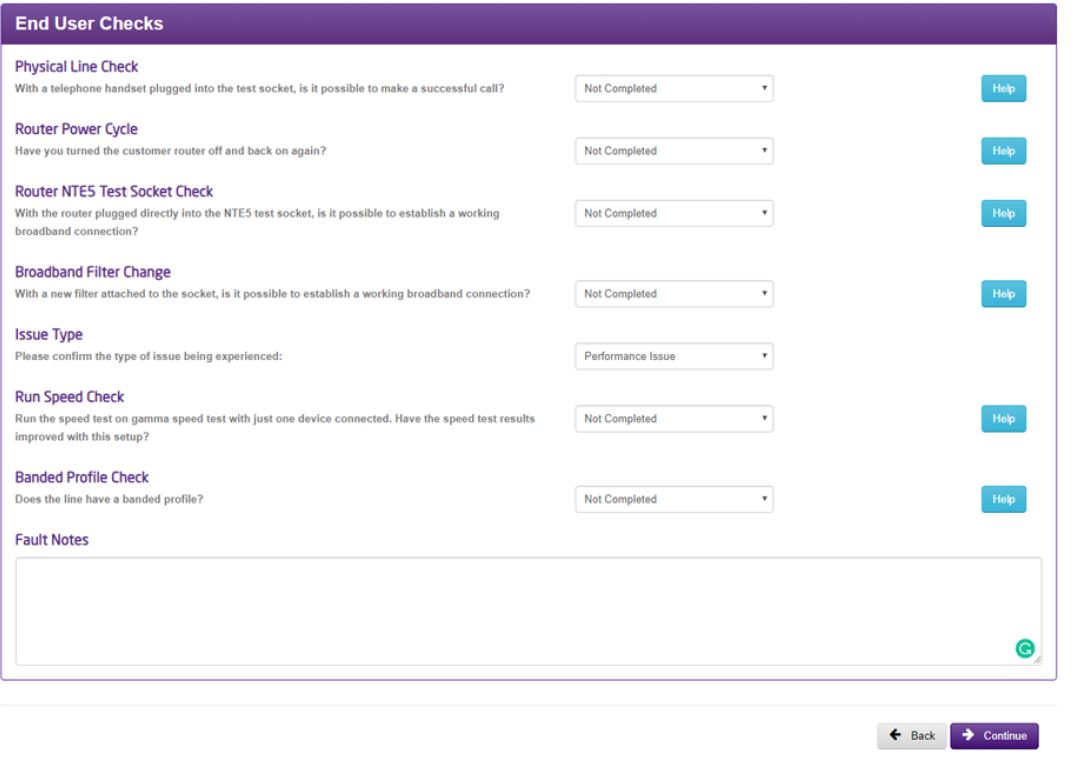
You will notice in the testing details panel at the top of the poge that the end user image will turn Green or Amber at certain points, this is purely a visual representation of the responses you have put into our end user check questions in the journey. Essentially if the image is showing as Amber, this means you have entered that all the end user checks have not been conducted, the reason we mark it amber is that we suggest you do so (meaning for beginner users, it’s a clear representation that there is possibly more they can do before raising the fault into us).
Supplier Diagnostics #
Once you have been through the health check/End user checks and acted accordingly, the next step is just to answer a few basic questions and confirm whether or not you would like to run an intrusive line (KBD) test.
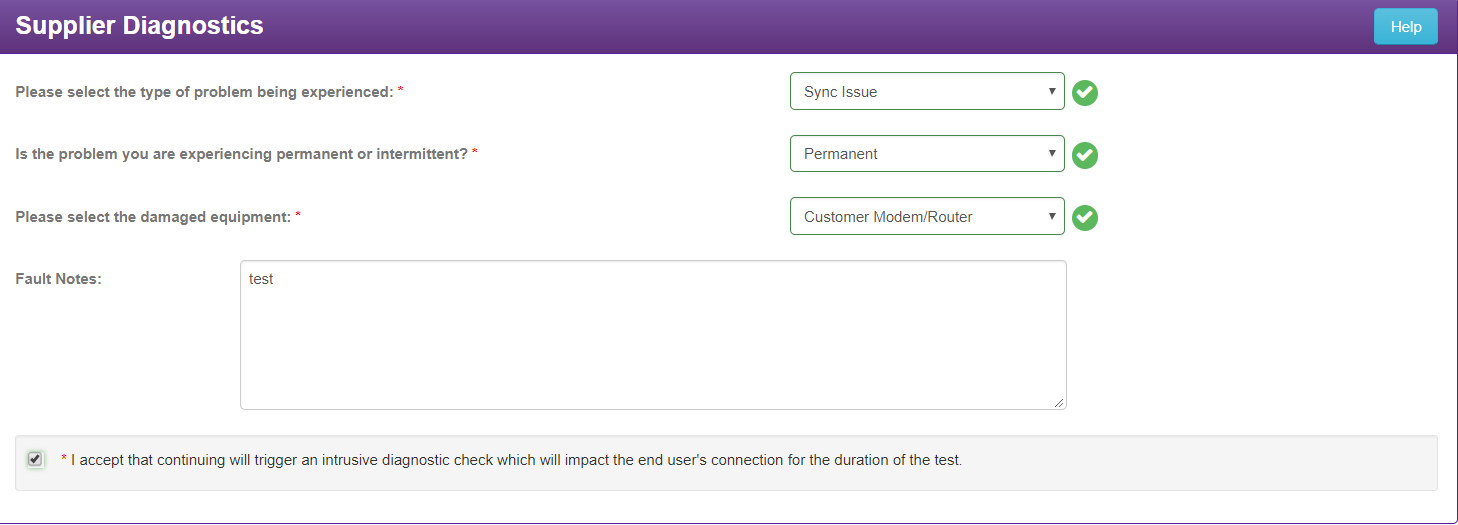
Once you are done here, you can hit the continue button and then a KBD check will be run in the background for you (this can take a couple of minutes to process).
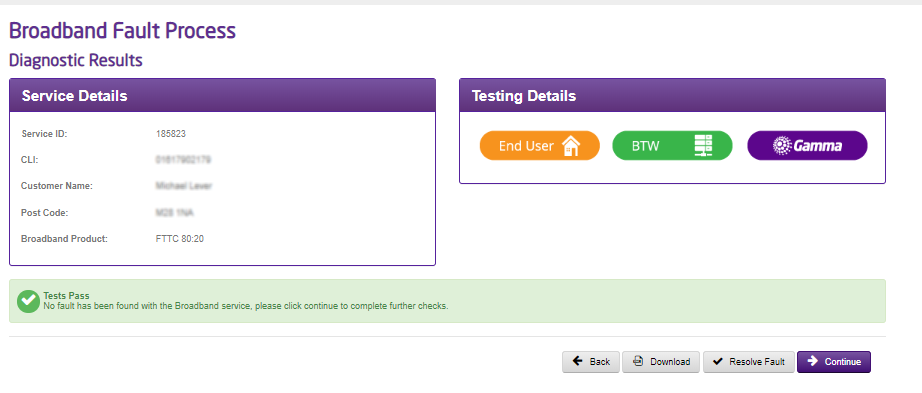
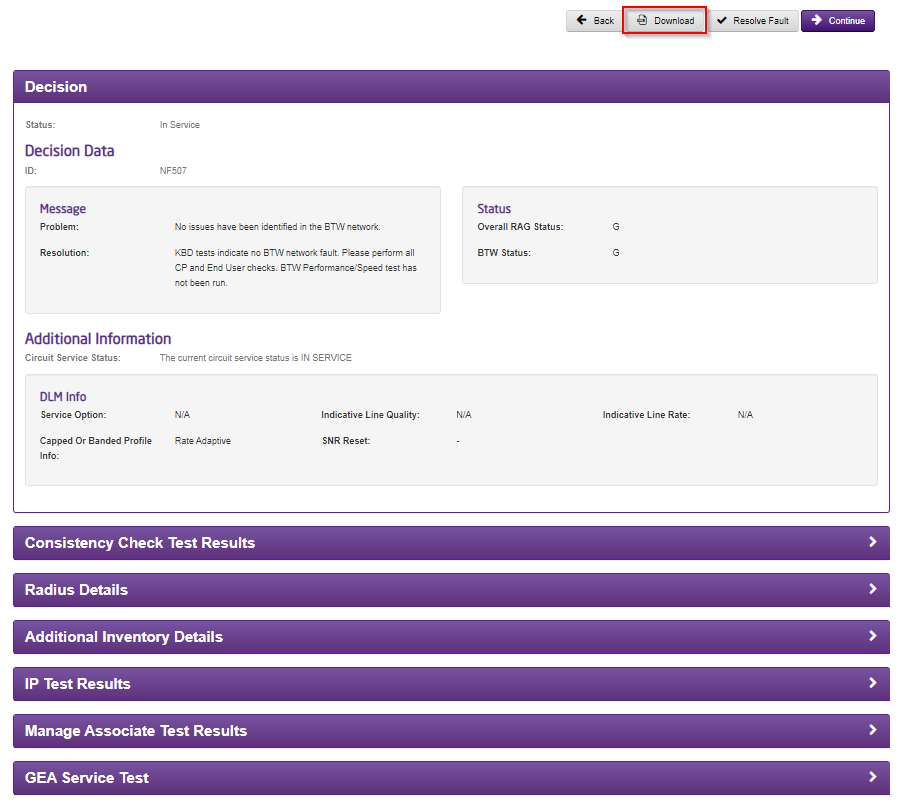
KBD results page #
Once this page has loaded you will be presented with all the information you can consume from a KBD check. When Gamma run diagnostics within BT’s systems we use a KBD check to complete diagnostics and identify any obvious issues within the customers/BTs network before deciding on whether an engineer is required (so now as a user you have access to the same tool we would use internally). It is worth noting at this point that unless a KBD check has been run, BT will not allow any fault to be raised directly to them. Please also be aware that for copper based services, the KBD check is intrusive and service affecting meaning you will see your service drop for approximately 5 minutes, however this is not impacting for fibre services.
As you can see in the screenshot below, when we run a KBD check, BT will provide us with a RAG based response which will show you as a user if there is an issue on BT’s network, this response will be easily visible on the ‘BTW’ image in the testing details panel as shown in the screenshot below.
On this page, you will also be able to see a full breakdown of the KBD results which have been returned from the check and you will also be given the ability to download the file itself for your own personal use.
Please see below a list of some of the various values you will see returned in a KBD check for both fibre and copper circuits, with information on how to interpret them:
Fibre Results #
Decision | |
Consistent Check Test Results | Your sync speed should match the with profile, or BRASMSAN, speed. This is useful for performance issues. If this is a “Pass” then it is OK, though any mismatches could cause drops in connection and speed issues. |
Radius Details | This checks for successful log in’s, including the login ID. It also shows any rejections with the user name and password (authentication/PPP details). This also shows you the dates and times of when a user was logged in and how long the session has been live for, as well as how much data the connection has received and sent. |
Additional Inventory Details |
|
IP Test Results | This shows you how many packets are being sent and received on the connection, as well as any packet drops. |
Manage Associate Test Results | This checks the BT Wholesale network for any potential issues, such as outages. If there is an issue this will display a message from BT Wholesale. |
Copper Results #
Decision | |
Status Check Results | This shows the line stats, such as Loop Loss, SNR Margin, Errored Seconds, HEC Errors, Cell Count, maximum stable rate, fault threshold rate, mean time between retrains and mean time between errors. |
Copper Line Test Results | This lets you know if the line is OK and within limits. This will show you if an appointment is required and also lets you know the distance between the exchange and the NTE. |
Consistency Check Test Results | Your sync speed should match the with the profile, or BRASMSAN, speed. This is useful for performance issues. If this is a “Pass” then it is OK, though any mismatches could cause drops in connection and speed issues. |
Access Profile Results | This shows you the change of the profile of the line by the DLM over a period of time. |
Radius Details | This checks for successful log in’s, including the login ID. It also shows any rejections with the user name and password (authentication/PPP details). This also shows you the dates and times of when a user was logged in and how long the session has been live for, as well as how much data the connection has received and sent. |
Additional Inventory Details | |
IP Test Results | This shows you how many packets are being sent and received on the connection, as well as any packet drops. |
Manager Associate Test Results | This checks the BT Wholesale network for any potential issues, such as outages. If there is an issue this will display a message from BT Wholesale. |
DP Neighbouring Data | If available this will give you some information on similar lines near your customer’s. Does not always return information and will never display information that you can use to identify the line. |
Access Details | This shows you an analysis of the lines performance over the last 14 days. |